

About
The “CRAVEzero-life-cycle-tracker” is a shared interdisciplinary tool for all stakeholders in the life cycle of nZEBs. It provides a shared framework for the organization and management of nZEB projects.
It can be used for both as an editable process map and a management tool, providing necessary actions that need to be taken to reach the goal and best practice guidance from the CRAVEzero consortium. It reflects the actions in nZEB project management and provides strategic leadership. It incorporates nZEB design principles, promotes integrated working between project team mem-bers, and provides the flexibility to match project-specific challenges. “CRAVEzero-life-cycle-tracker” is an easy to customize electronic document that can be adapted to the specific needs of any practice, team or project. It organises the process of briefing, designing, constructing, maintain-ing, operating and using building projects into a number of key stages. It gives details of the tasks and outputs required at each stage, which may vary or overlap to suit specific project requirements. It is a downloadable spreadsheet, in Microsoft Excel format, containing customizable tables allowing easy creation of the project roles, design responsibility matrix and multidisciplinary schedules of services. It is part of the mindset of stakeholders involved in the construction industry and is woven into their processes.
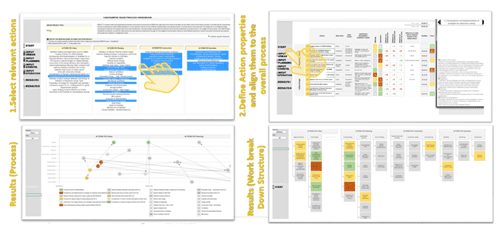
Step 1 – User InterfaceThe tool "CRAVEzero-life-cycle-tracker" consists of four phases from urban planning to operation to renovation and more than 50 key actions along the entire process. All measures necessary for a specific project to achieve the nZEB standard were defined and systematically selected with the interest groups involved. The actions are freely selectable (can be switched on and off).
The defined process phases ensure the consisten-cy of the entire CRAVEzero methodology.
|
|
|
Step 2 – WorksheetsThe workbook created for this purpose comprises several worksheets:
• Start
|
WORKSHEET 1 – STARTAt the beginning of the management tool, a checkbox can be selected on the right side if expert features are desired. This activation allows more functions on the main worksheets 3 - 6. In addition to the level of difficulty and importance, the various cost influences and dependencies of the various selected actions can also be shown. In addition, selecting this checkbox makes worksheets 7 - 10 visible. These work-sheets show the individual actions that can also be edited if expert features are enabled.Furthermore, the individual actions for the project can be selected in this sheet to create an individual nZEB process. On the side menu on the left, it is possible to navigate to the other worksheets. This side menu is also displayed on all following sheets (except sheets 6-10). |

|

|
WORKSHEET 2 - PARTIES“Worksheet 2 – Parties” shows the different stakeholders, which can be selected in the following worksheets. The stakeholders can individually be renamed by entering alternative names. |
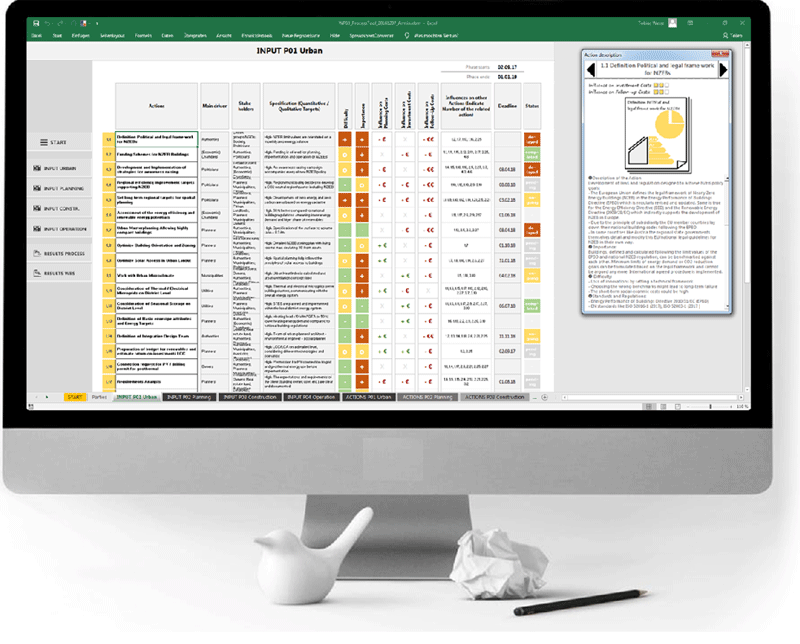
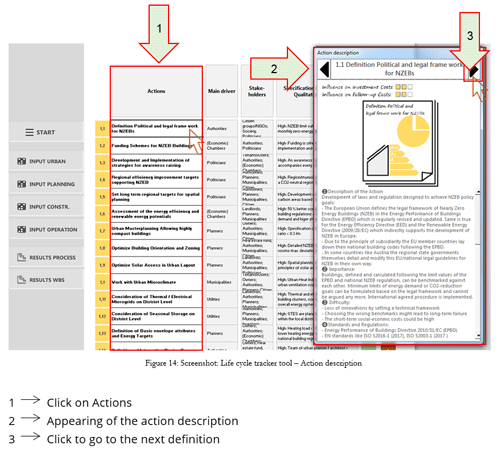
WORKSHEET 3 - 6 (Input Part I)In the “Input-Worksheets” for the selected life cycle phase, there is the side menu, which can be used to select the worksheets. In the column Actions (1) all actions that have previously been selected on “worksheet 1 – Start” are displayed. If more detailed information about the actions is required, a pop-up information field (2) appears by clicking the left mouse button on the action. By right-clicking with the mouse on the black arrow in the information field, it is possible to jump to the description of the next action. |
|
|
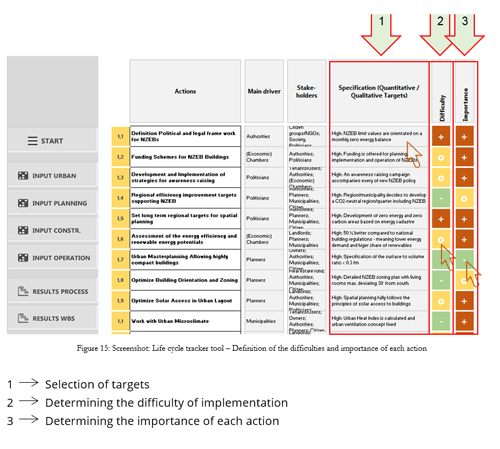
WORKSHEET 3 - 6 (Input Part II)In the column with the heading “Main driver”, the main stakeholder responsible for the action can be assigned as presented in Figure 15. In the next column called “stakeholders”, stakeholders should be selected who are associated with the action but are not primarily responsible for its implementation. In the tool, a preselection off typical stakeholders for the respective action is given, this can be changed. In the fourth column Specification (1), the qualitative requirements for the actions can be set by clicking with the left mouse button – and selecting high, medium, low goals. The column “Difficulty” (2) estimates how difficult the implementation is in relation to the individual requirements of the actions. In addition, the priority of the implementation can be specified in the col-umn “Importance” (3). Also, for these two estimations, the input can be controlled by clicking the left mouse button on the input field. |
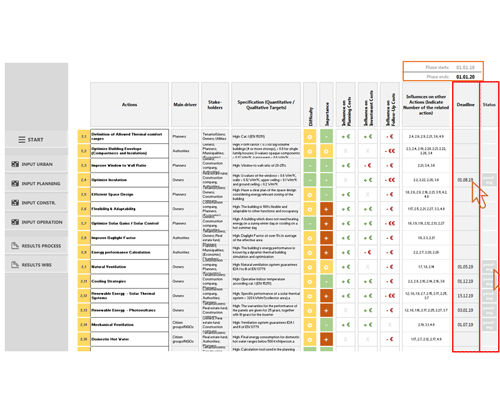
WORKSHEET 3 - 6 (Input Part III) EXPERT VIEWIf the expert view has been activated on the first worksheet, additional entries can be made in addition to the functions already described in the basic view (more input fields appear on the right). In the columns “Influence on Planning Costs”, “Influence on Investment Costs” and “Influence on Follow-Up Costs”, expected cost changes can be entered. “+€” represents a cost increase in the respec-tive planning step and “-€” indicates a cost-saving. This input can be changed with the right mouse click. |

|

|
WORKSHEET 3 - 6 (Input Part IV)In the column “Influences on other Actions” (1), actions are to be selected which have a correlation to other actions and interact with each other. To do this, right-click on the corresponding action (1). This opens another window in which all actions selected in the Start worksheet appear (2). By holding the Shift button, all actions can be selected that might have a correlation to the selected action. If the OK button is clicked, the window will close again. |
WORKSHEET 3 - 6 (Input Part V)In the column “Deadline”, a date for each action can be defined in order to specify by when the action must be completed. Also in the upper right corner of the sheet, the beginning and end of the phase need to be entered. The column “Status” provides an overview of the status of the respective action. This setting can also be adjusted by clicking the right mouse button. Here the status can be changed to “pending”, “ongoing”, “completed” or “delayed”. |
|
|
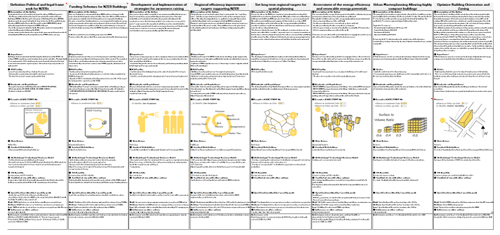
WORKSHEET 7 - 10 ACTIONSWorksheets 7 to 10 are only displayed if the expert view was selected on Sheet 1 - Start. They show a detailed description of the actions. In this view, it is possible to revise these definitions by clicking on the respective text fields.”. |
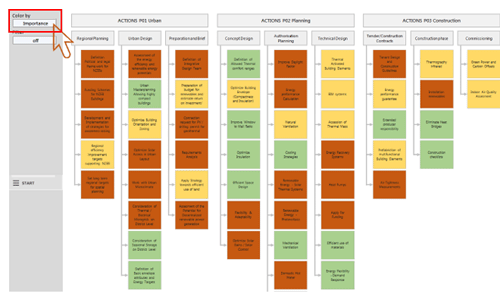
WORKSHEET 11 - ACTION VIEWThis worksheet shows the results of the entries previously made in worksheets 3 to 6 as a work-breakdown structure. The four phases are again split into three categories to allow a more precise classification. This worksheet shows the results of the entries previously made in worksheets 3 to 6 as a work-breakdown structure. The four phases are again split into three categories to allow a more precise classification. |
|
|
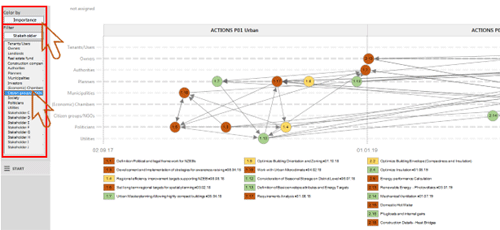
WORKSHEET 12 - TIMELINE & RELATIONSThis worksheet is only visible if the “expert view” in “worksheet 1” has been selected. It graphically displays the individual timeline based on the entries in sheets 3 to 6 and shows the correlations between the actions again. A legend appears below the diagram to facilitate navigation. |
Download the Process Tracker Tool here |