

Processes

nZEB life cycle processes
In order to be able to optimise nZEB related processes, project specific roles, interactions, tasks and schedules, depending on the stakeholder perspective, must be known. Building owners, investors, tenants, construction companies and planners have different interests and are involved in different phases in the life cycle of buildings. There is a general lack of understanding, transparency and uniform methods when it comes to the process of nZEBs.Clear and comprehensive life cycle processes are needed to ensure goals (both cost savings and energy) are met in a cost-effective manner. The following chapter presents a framework for ensuring the process quality in the life cycle of nZEBs. It outlines the key actions needed to ensure the achievement of energy and cost related goals presenting an optimal replicable planning, design, construction, and operation process. More information can be found in the CRAVEzero process reports.
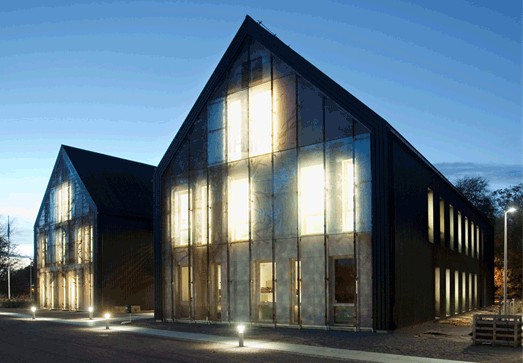
Figure 23: Vala Gard – Skanska Sweden
In addition to legal and urban boundaries, buildings are essentially defined by owners and investors. Technical quality and high comfort standards have to be achieved within project specific budget limitations. Architects and specialized planners typically translate the client’s ideas and wish into real plans and are responsible for the appropriate execution of the building project. Construction companies and craftsmen from numerous different disciplines are involved in constructing the building. There is a constant coordination process between the client, the planners and the contractors to prepare the construction of a building and if necessary, to react to changing conditions like costs, schedules, requests from the client, weather, etc. (Arnold 2005). The range of services provided to buildings in the urban context today has also changed over time and gained new aspects. Nearly zero energy buildings increasingly become active participants of our energy supply infrastructure and raise new challenges concerning the quality of planning, construction and operational phase of a building. This results in innovative energy concepts for both buildings and the districts. Innovations related to the realization of nZEBs arise in different life cycle phases of buildings and at different points of the value chain in the building industry. To reduce costs, accelerate processes and assure the quality of nZEBs the right decisions have to be taken at the ideal time within the overall process. In the early stage of building design, it is easy and inexpensive to make significant design changes to reach the best solution. Each design stage adds more and more details to the project, so it becomes more challenging and costly to make changes during the progression to further stages. Traditionally, during the design process for a building’s energy system, the architects send the initial building designs to engineers, who then test out a variety of energy system scenarios for a few weeks. During the time, when the engineers can come back with an analysis, the architects have often made significant design changes. This process can not only lead to less-efficient and more-expensive HVAC systems, renewable energy systems and envelope qualities, but usually leads to longer project timelines, unexpected construction issues, delays and budget overruns. The following process-framework developed in the CRAVEzero project makes it easier, faster and therefore cheaper to plan new nZEBs by helping to identify the most cost-effective and energy-efficient solutions and business models, all while reducing the risks of redesign, delay and budget overruns by optimizing overall processes.
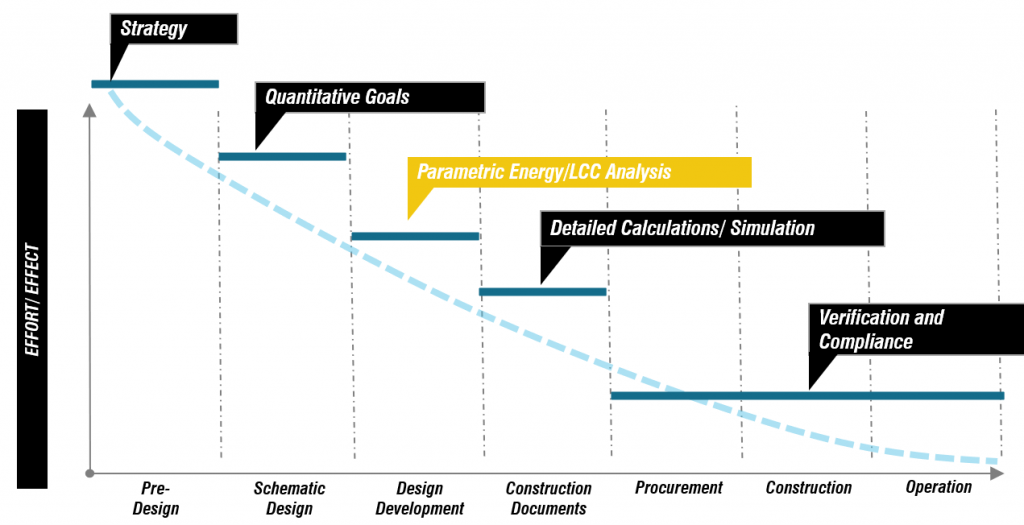
Figure: Influence, measures and decisions in the individual phases of the buildings’ life cycle
The Figure, is based on the MacLeamy curve (IDEAbuilder 2012). It shows how the effort and cost of design changes can be minimized at an earlier stage of the design process when the effect can be maximum. The aim is to facilitate the integration of building energy and life cycle cost calculations in the early stages of the building design. The MacLeamy’s curve is a well-known concept of how shifting decision making in building design early into the process leads to great benefits in building performance and cost. It is very costly to change the technical solution sets to reach nZEB at a late design stage. Hence, early-stage energy and life cycle cost analysis is vital for cost-effective nZEBs.
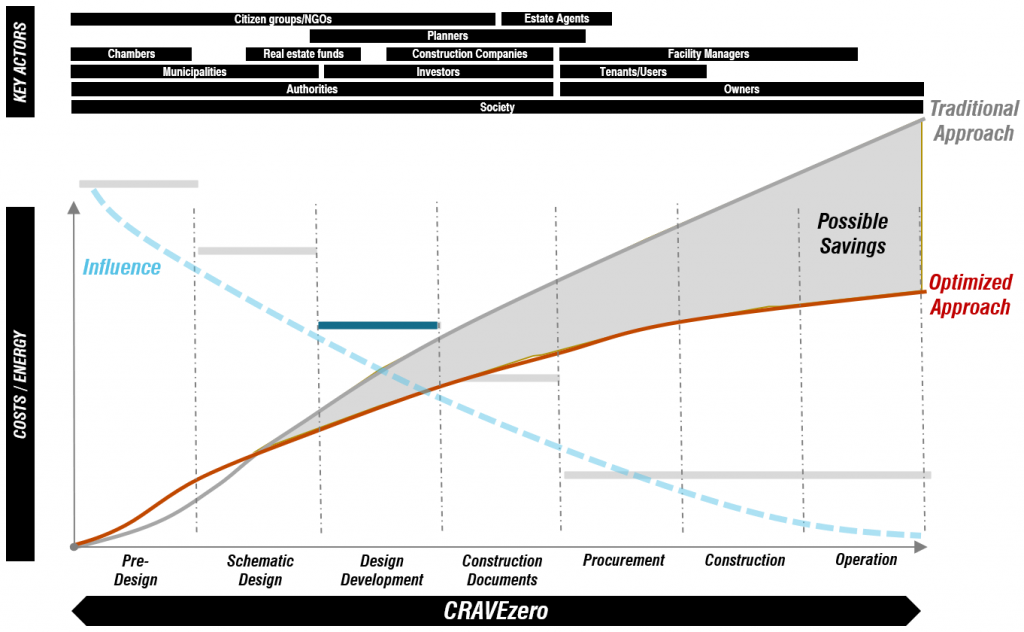
Figure: Decisions in the early phases of project development have a strong influence on life cycle costs
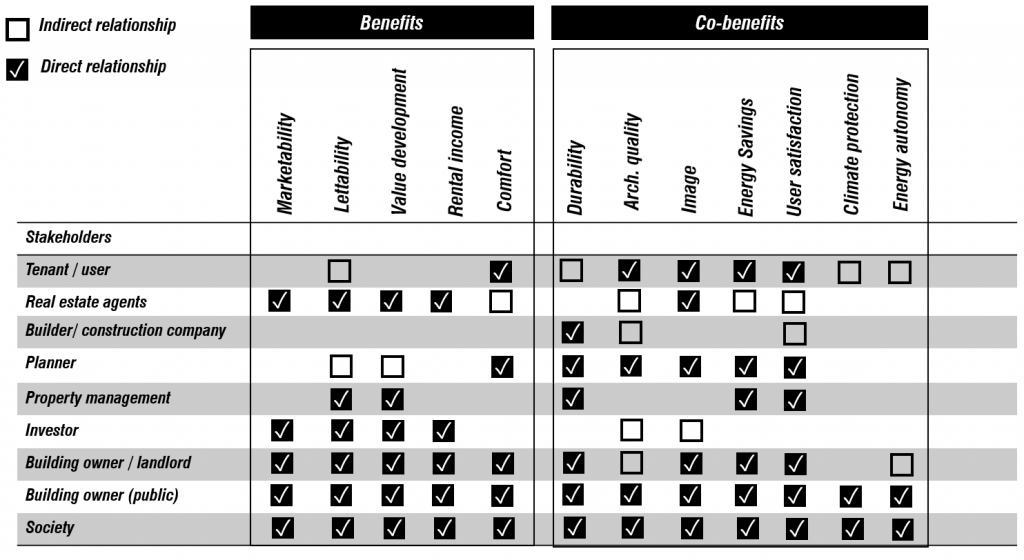
Figure: Stakeholders’ influence in nZEB life cycle phases
In the life cycle of a building, there are different interests of the actors and derived from this also different perspectives, observation periods and target values. There is the tenant/user, the real estate agent, the building contractor, planner, property manager, investor, owner and also the company which is directly or indirectly involved in the building process. These actors are involved in the overall process over a certain period of time. While the tenant is primarily interested in the operational phase, the planner is usually more likely to deal with the building only until its completion. If a property is financed and used by the resident himself, the entire life cycle up to a change of use is usually of interest. Depending on the approach, this can be between 25 years, after repayment of the bank loan, and up to 50 years, after increased consideration of the use. For society as a whole, the entire service life of a building, including its demolition and disposal, usually counts. This can also be shown in the influence and interest of stakeholders in different life cycle phases. The period under consideration must, therefore, be determined in advance with the parties involved. For most of the considerations of the entire building, between 25 and 50 years have proven to be reasonable.
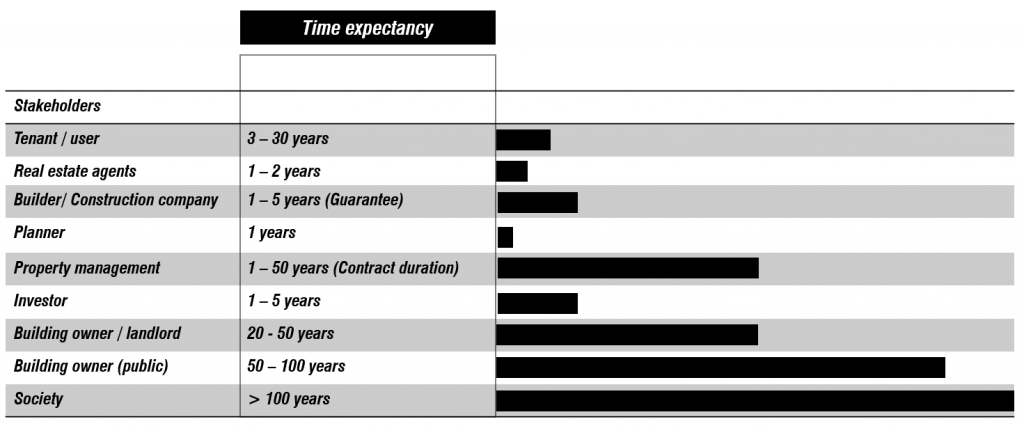
Figure: Stakeholders’ time expectancy of a nZEB project
This chapter describes the “CRAVEzero process”, a common, interdisciplinary framework of nZEB life cycle processes for all involved stakeholders. This well organized and transparent process is the key to achieving the goal of cost-optimal and sustainable nZEBs throughout the entire life cycle. The complexity of nZEB related processes is one of the main reasons why nZEB developments fail in the planning, construction or later on in the operational phase. Already from the very beginning, pre-requisites must be created in order to define the requirements and clear project objectives. Too often, promising building concepts fail to achieve costs and energy goals because project participants are not sufficiently aware of the manifold interactions of holistic planning contexts.
The process of nZEBs
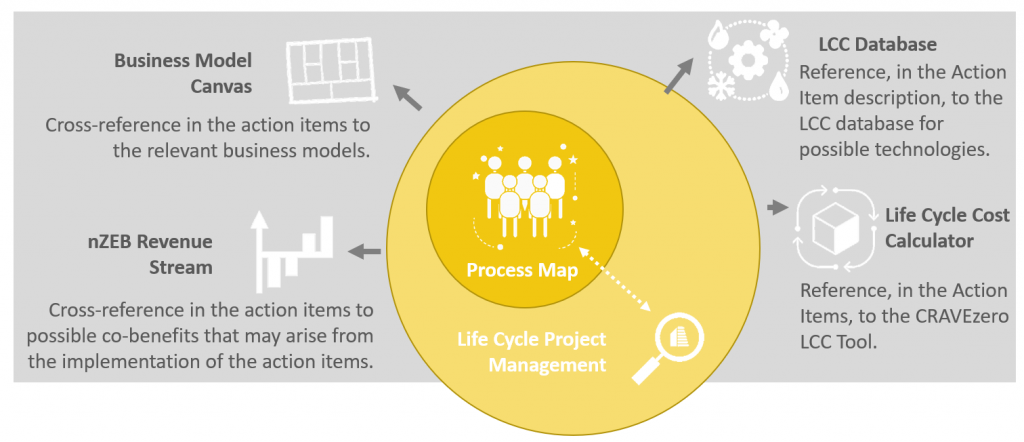
Figure: The CRAVEzero process and its connection to the CRAVEzero pinboard
Each building has its unique process, where architects often start from scratch, collect the information and constraints of the local context, develop the building, carry out cost-optimal performance analyses, hopefully include an evaluation of the potential for using renewable energy. This means extra costs for the design process. Stakeholders repeat almost the same procedures without a coordinated
and standardized process. As a starting point, an organized framework for a systematic approach for the life cycle process of low-cost nZEBs is needed. A clear connection between the building performances and the related costs is essential for ensuring the clarity of the process. A strategic element in the whole process is the introduction of a performance-based procurement approach as a common practice not only for public tendering but also for private construction.
In order to minimize risks and possible bottlenecks, obstacles must
be identified at an early stage. It is necessary to establish a common planning understanding for nZEBs among all actors early on. The design of new nZEBs begins with maximizing passive design, yet limiting energy consumption from the grid. To do this, planners often need to challenge the norms of traditional designs. In the life cycle of a building, there are different interests of the actors and derived from this also different perspectives, observation periods and target values. There is the tenant/user, the real estate agent, the building contractor, planner, property manager, investor, owner and also the company which is directly or indirectly involved in the building process.
CRAVEzero Life cycle process
phases
To achieve the nZEB goal at reduced costs, additional strategies and refinements of existing planning, construction, operation and maintenance practices are required. In CRAVEzero, a process has been developed to highlight the changes in a common practice. This implies that a standard process for the life cycle (from planning to demolition) is mapped and supplemented with key information. The CRAVEzero Process Map and the associated CRAVEzero Process Tracker outlines the key actions required to ensure the achievement of energy and cost related targets through repeatable planning, design, construction and operational processes. The development of a clear and comprehensive lifecycle process that includes specific and measurable actions (both cost savings and energy savings) is crucial to ensure that the targets are met cost-effectively. The CRAVEzero process is the centerpiece of this research project. In the graphical representation of the process map, all participants in the building life cycle can identify their role and recognize their tasks and obstacles. The tools, methods and information developed in the research project can be accessed via the process map. The user can find the following information in this CRAVEzero Process Map:
- Existing process: The “CRAVEzero Process-Map” describes the overall process and steps to
be taken for all related stakeholders for all phases of a project’s lifecycle - Actions: Tasks
/ actions were identified which lead to the ability to plan, build and operate
a nZEB. These activities were assigned to stakeholders and already existing
process steps. - Process evaluation results: Actions are assigned to the main drivers and
other stakeholders to clarify the question of responsibility. In addition, the
correlations between all actions and stakeholders are shown. - Pitfalls and bottlenecks: Pitfalls and bottlenecks that can endanger deadlines, budgets and
quality of the nZEB project.
Urban Planning
The political decision and urban planning process lays the foundation for all upcoming phases of new nZEBs. It is in this phase that the common interest for low emission and low cost for public services is considered.
Political decisions and urban planning are usually done proceeding from a large Scale (e.g. regional planning) towards a local scale.
The main tasks on
each decision and planning level are:
- Investigation and analysis of
the existing situation - Definition of a strategy
- Consideration of demand
- Definition of targets for
spatial order - Documentation and
implementation of strategy and targets
These documents may come in the form of plan material, regulations, laws, treaties with third parties, e.g. energy suppliers, landowners etc. The documents may be legally binding or hold recommendations for further planning on a more detailed level. Several actions can be taken on a regional planning level to promote nZEBs. These include the definition of the political and legal framework, as well as offering funding schemes and awareness raising. Also, the definition of targets is an important action on the regional level, since regions can often be linked to specific climates which again have an impact on the building design. Actions can have the intention to encourage, enable or enforce. The focus of urban design in the context of nZEBs is on environmental conditions like sunshine, microclimate and wind lanes, and infrastructural conditions at a neighborhood level. Infrastructural conditions on neighborhood or district level include thermal and electrical microgrids, seasonal storage as well as renewable energy use and building envelope attributes and targets.
It is important to be aware of the common pitfalls that can compromise project success in the urban planning phase. Below, pitfalls and bottlenecks are listed that can endanger deadlines, budgets and quality of the nZEB project during the urban planning phase. The most common pitfalls and bottlenecks are:
- Demand planning in the urban
planning phase - Investigation of potentials for
renewable energies at the site - Political support / incentives
- High demand for housing
- Development goals do not
correspond to nZEB standard
The political decision and urban planning phase are layered into different levels. It is of uttermost importance that the interdependencies between these levels work well: That means that there have to be well-defined and checked mechanisms for information exchange between the levels. For example, it makes no sense to offer subsidies for certain energy supply systems on a regional level if, on a local level, other systems are preferred. Moreover, in some cases, it can be useful to integrate actions on different levels. A joint planning team of regional, urban and energy planners could, e.g. better integrate interests both of urban population and extra-urban environment.
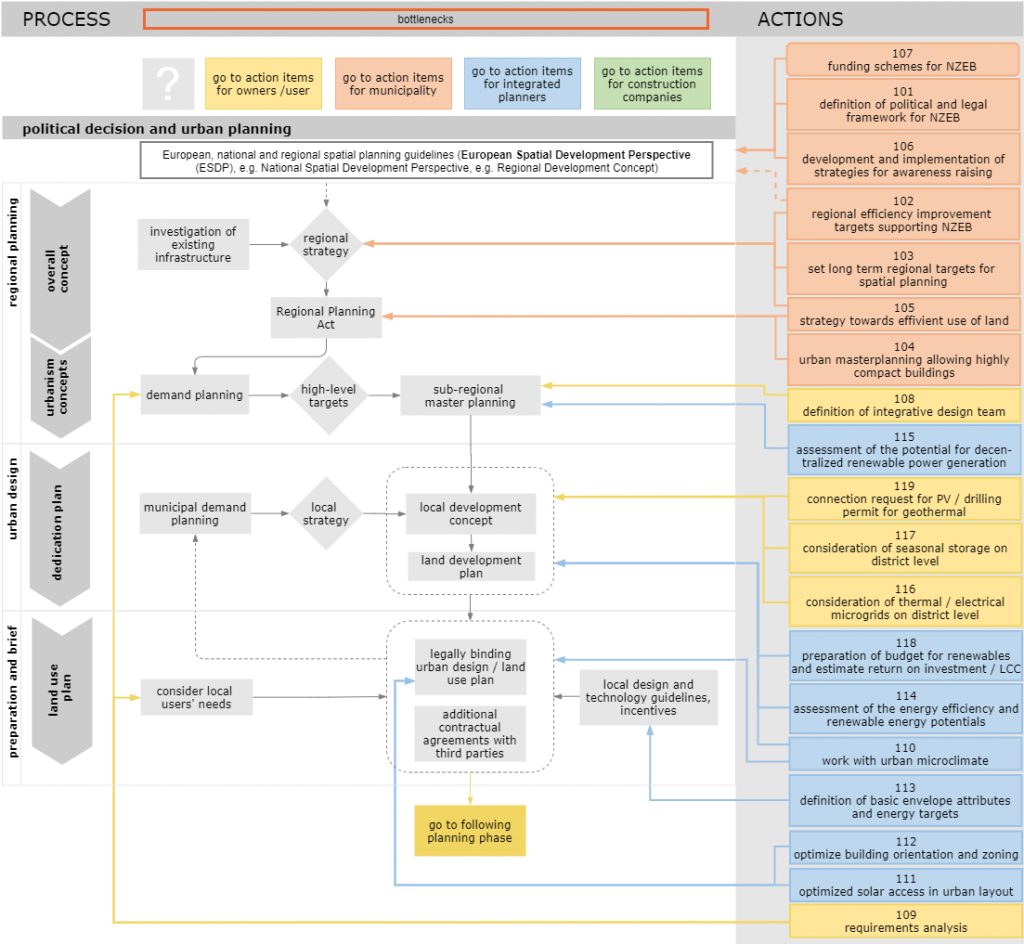
Figure: Optimal CRAVEzero nZEB urban planning process with stakeholder-related actions
A detailed description of the individual actions in this phase and the overall optimal urban planning process (Figure 29) can be found in the report: Guideline I – nZEB Processes. To ensure the successful cooperation of the stakeholders, it is important to show the interdependency of individual nZEB-related actions in this phase to other stakeholders and actions. The following figure shows the dependencies of the different actions. This visualization (Figure 30), shows interdisciplinary relationships in order to achieve a common understanding of planning based on a workshop with stakeholders within the project. In addition to the different actions of the phase to be considered, the main responsible actors are listed to obtain a quick overview. The colored fields describe the dependencies of the different actions on each other. The red fields describe a bilateral, while the blue fields describe partial correlation (e.g Action 1 “Definition of political and legal framework” has a bilateral correlation, marked in red with Action 2 “Funding Schemes for nZEBs).
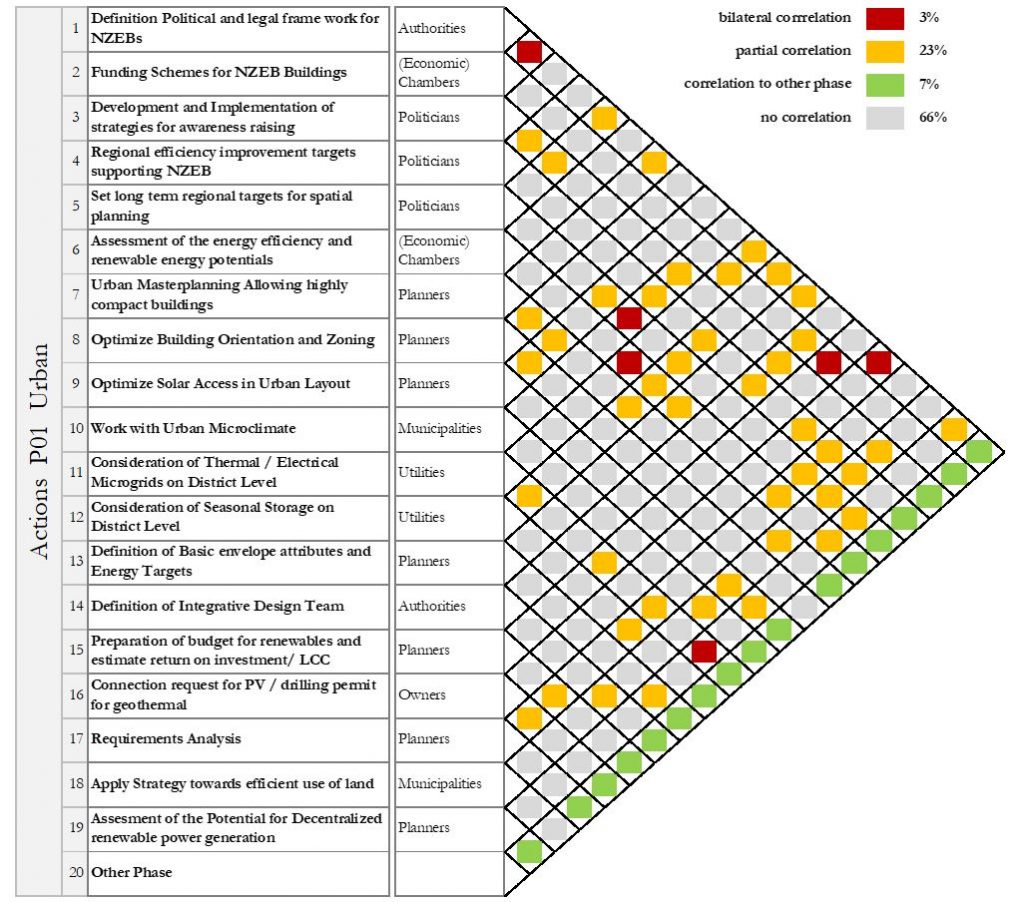
Figure 30: Urban planning process with stakeholder-related actions
Integrated building design process
An integrated building
design process may have many definitions and meanings. In general, it may be considered a holistic approach, which considers the interactions between different actions, rather than optimizing them separately. E.g. optimizing building layout/plans from a user perspective may have major effects for the superstructure of the building, which in turn causes unnecessary additional costs.
The process must be supported by the entire design team. The outcome
of the process should be targeted to create a building with:
• High architectural
quality
• High energy
efficiency and low environmental impact
• Healthy indoor
climate
To be able to start the demand planning it is important to understand the client´s requirements and clearly define the project goals. It is central that the entire design team understands the goals of the project and understands that the work needs to be iterative and depends on cooperation. For projects with considerably higher goals, like nZEBs, the design process should start with a feasibility study showing important technical solutions, costs, savings and potential solution sets that work well together. This provides a basis for the decision of the main targets for the project.
The quality of the processes depends on the project organization and the information provided about project goals and framework conditions.
Only a simultaneous and comprehensive interdisciplinary project team can fully deal with the dependencies between function, form and energy and thus also identify and evaluate the manifold cost effects of actions in the process.
This applies in particular to the financial consequences of architectural decisions on energy costs that cannot be determined by the LCC calculation. Close and iterative cooperation also reduces information losses and planning collisions and thus prevents time- and cost-intensive planning loops.
The exchange of information between partners is becoming increasingly relevant with the growing complexity of construction projects. This is important because the main reason for planning errors and missed deadlines are inadequate and incorrect availability of information. Therefore, the definition of communication channels is of great importance for the reduction of data and time loss. Smooth and transparent communication is the key to efficient planning of nZEBs. This must be retained throughout the entire process, as subsequent decisions must be made based on all information from previous decisions and dependencies.
Integral planning is the prerequisite for a lifecycle-oriented process that meets the economic, ecological and socio-cultural objectives. Architects and engineers work simultaneously and team-oriented on the best innovative solution and constantly check if qualitative and quantitative goals are reached. A data model, building information modeling – BIM, maps the process from the initial idea to all virtual planning variants and the real construction processes to the lifelong operation of the building.
The integral design phase is divided into different phases, in which knowledge carriers from the different specialist areas come together. This development takes place in the investigation of variants and the evaluation of the different concepts based on ecological and economic considerations. The integral design method makes it possible to compare variants with each other and select the concept that corresponds to the objectives of the client and the target values.
When the authorization planning phase begins, the design team may have changed (new members come in and members may have left the team). It is therefore important to revisit and review the goals of the project, ensuring that goals and targets are understood by all members. During authorization planning, the final design is not defined in detail. However, in order to handle critical issues that may affect the project goals (identified in the concept design) some technical solutions may need to be studied in detail.
Also, this part of the process is iterative and depends on cooperation. Interdisciplinary work is crucial in this part of the process.
During technical design, the verification of the goals of the project is defined in detail.
As the commissioning tests are crucial for the outcome of the project, these tests need to be defined in this phase.
In order to manage information effectively, all members of the design team must have access to information (e.g. specifications, Gantt scheme, drawings etc.). This is effectively handled by using cloud-based management tools.
During the concept design, also critical pitfalls and bottlenecks which may affect the project goals need to be identified. Below, pitfalls and bottlenecks are listed that can endanger deadlines, budgets and quality of the nZEB project during the integrated building design process. The most common pitfalls and bottlenecks are:
- Demand planning client
- Integral planning
- Project management /-coordination
- Consulting expertise
- Tools
- Database
- New technologies
- Supply with (renewable)
energies - Subsidies
- Environmental engineering
services - Process definitions
- Information exchange /
cooperation
The following figure shows the
predominant activities in this phase again and also shows the actions that have
to be set at the appropriate time.
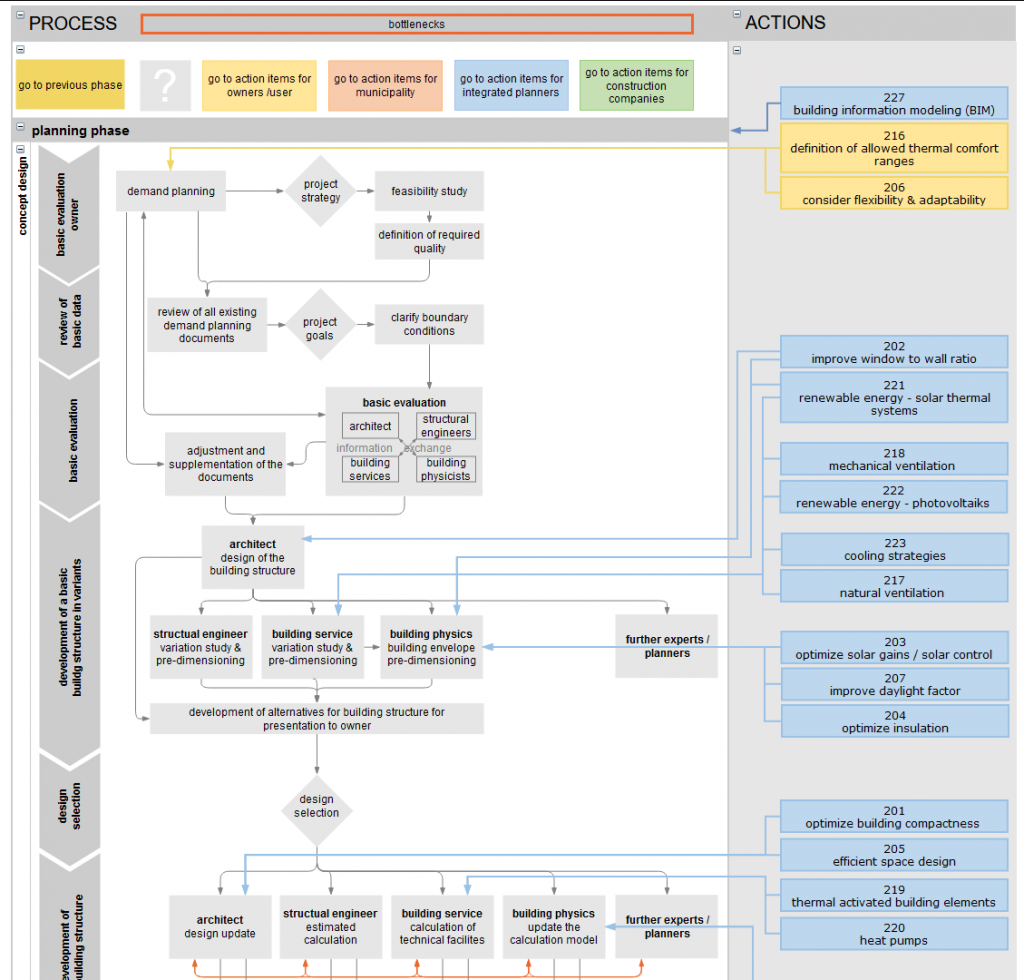
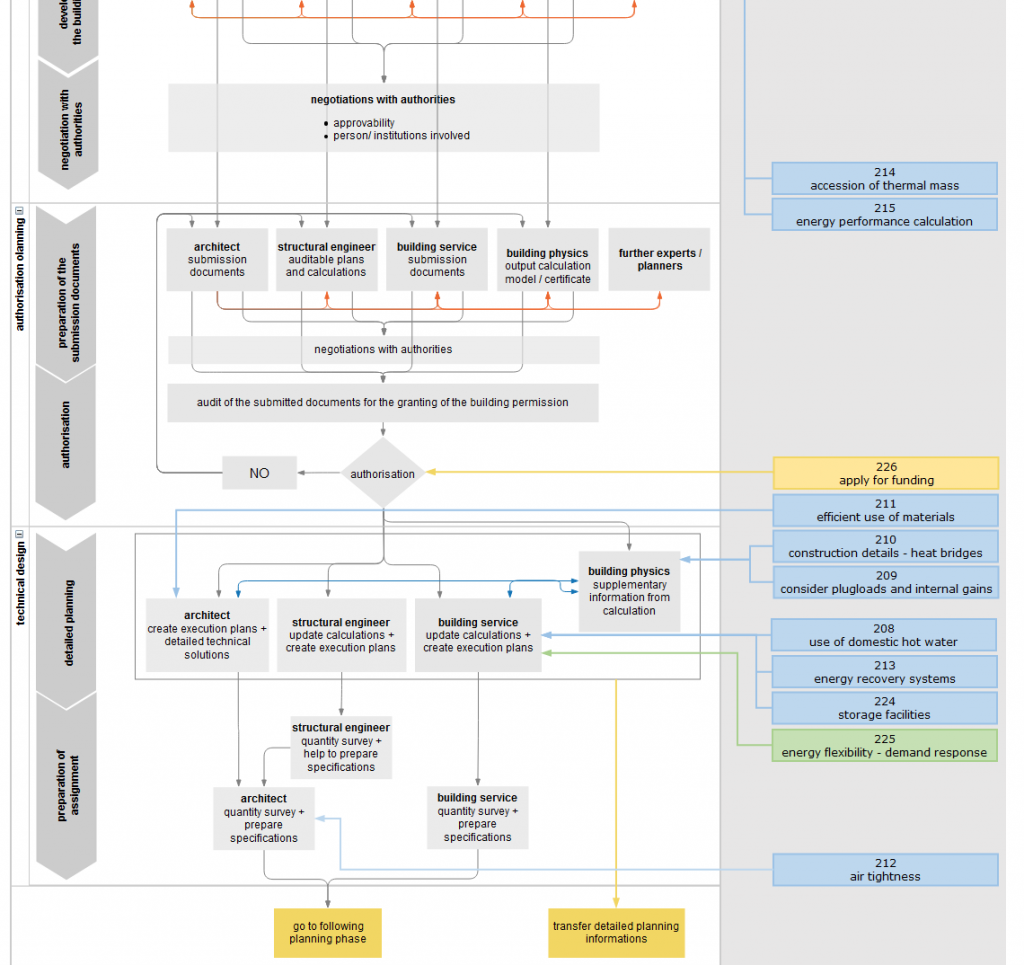
Figure: Integrated building design process with stakeholder related actions
A detailed description of all actions can be found in the ’Guideline
I – nZEB Processes’.
The following figure shows the correlations between the different actions and stakeholders.
Construction process
Considering the building as a manufactured product also allows the application of lean management strategies, which have been widely used in the industry sector (starting from automotive). In the building sector, there are only a few experiences, mainly performed in big and very complex construction sites but also in smaller, standardized and highly industrialized concepts (for example BoKlok, a housing product by IKEA and Skanska). CRAVEzero focuses on lean construction and operational protocols, which can also be applied for low and mid-rise investment for low LCC nZEBs.
Lean construction is an approach developed to improve the efficiency and effectiveness of the construction process. Managing a lean construction means minimizing the waste of time, resources and materials, and thereby maximizing value. The presence of a general contractor, which manages and coordinates all suppliers and operators, makes it possible to optimize the entire system through collaboration, the elimination of obstacles and to fluidize the process, to achieve the value desired by the customer.
A key premise for successful lean construction is that materials and tools are available when an operation is scheduled to start, equipment, design and people are in place. Breaking down the work and planning it with a focus on letting the different disciplines work separately as much as possible in an area and handling the interfaces between disciplines. This can be achieved by defining several “construction phases” and sequencing these.
The constructions have to reach the maximum functionality, with the satisfaction of the final users. Manufacturers and suppliers have to be involved in the design as soon as possible, to achieve integration and cost-effectiveness of the building. Current achievements, progress, compliance with project requirements must be verified by specific coordinated and continuous measures. Better is facilitating quality control throughout the construction process, rather than doing this at the end when correcting problems is much more difficult and expensive.
Allowing an open communication between owner, project manager, contractors and engineering consultants is an issue that guarantees a better outcome.
The use of prefabricated systems and the displacement of the workings as much as possible outside the building site is a winning strategy. Using this technology it is possible to apply the principles of lean production to construction. Off-site construction reduces on-site work and locates it mainly in the factory, allowing reorganization of technologies and processes aimed at greater efficiency and quality. The main improvements between the standard method of construction and the off-site are:
- Guarantee of better control and
quality of the product. Thanks to the
industrialized systems the production is optimized and the performances guaranteed; - Production times are reduced
thanks to the effectiveness and precision of production processes; - On-site operations are reduced
to a minimum, the risk of unforeseen events, delays and additional costs are
reduced; - The scheduled times and costs are
more certain, reduction of uncertainty to the realization of the projects.
The reliability of the goods produced, the traceability of the components, their programmable maintenance as well as the containment of the energy costs become aspects decisive for off-site construction.
Another strength of lean construction is the improvement of health, safety, environment and also job satisfaction (quality of working condition is improved, better cooperation and fewer conflicts are a guarantee)
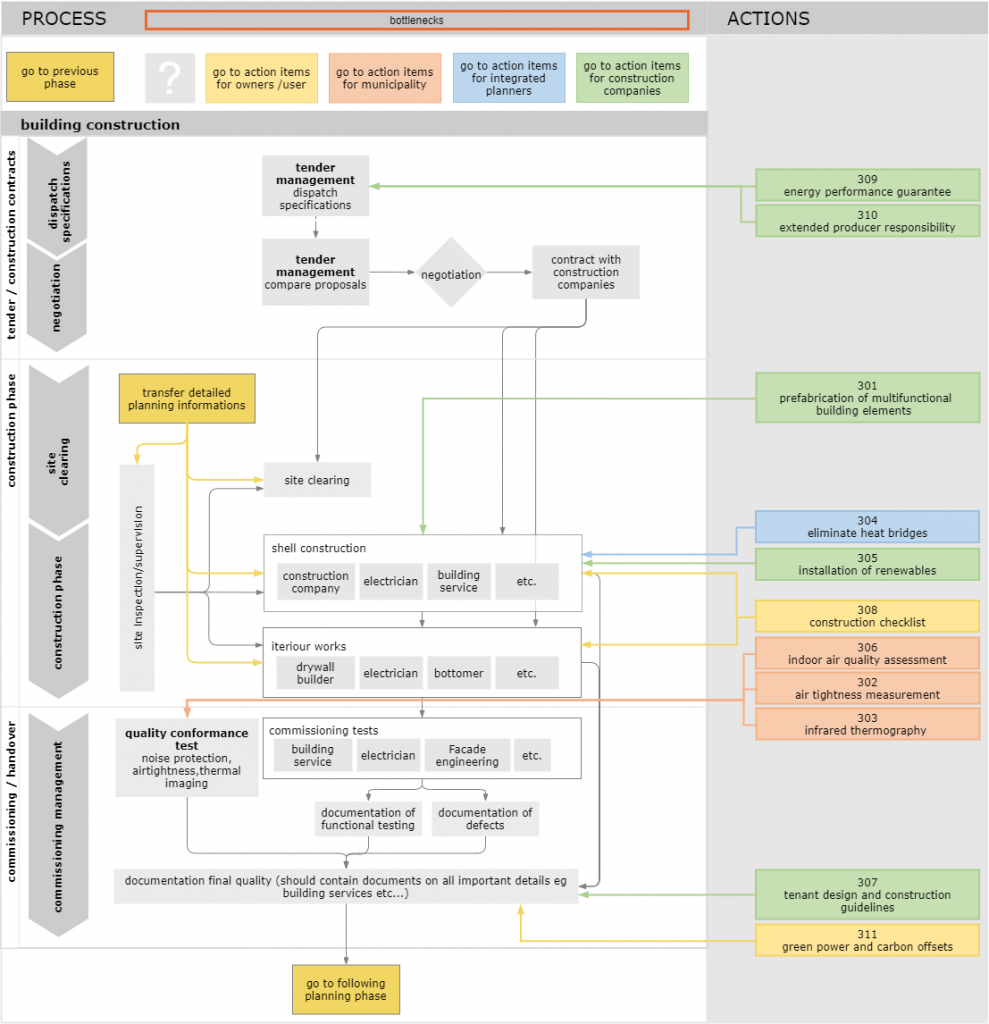
Figure: Construction process with stakeholder related action
Building operation process
At the end of the construction process, once the building is commissioned, tested, certified and the user has moved in, it is important to ensure the proper building operation. Facilities’ operations and maintenance include a broad spectrum of processes, tools and services required to assure that the building will perform the functions for which it was designed and constructed. An appropriate user behaviour, occupant involvement, continuous monitoring and optimized maintenance raise the potential for cost reduction and savings. During the operation phase, the tenants and owners of the building are the main actors. An operation and maintenance plan can be used to ensure that the building functions in the manner defined in the planning phase. This includes component life expectancy, a plan for recurring operating and maintenance sessions, deceptive routines, target values and performance indicators, and a plan for recurring inspections of target values. Also, a complete and always up-to-date documentation of the building, services and the plant technology is required during operation to be able to control building services engineering and to exclude damage due to incorrect operation, care and maintenance. All facilities of the building require maintenance during its service life. It is possible to perform both planned preventive or predictive maintenance and corrective (repair)maintenance. Preventive Maintenance (PM) consists of a series of time- and IT-based maintenance requirements that provide a basis for planning,scheduling, and executing scheduled maintenance. PM includes lubricating,cleaning, adjusting and replacing components. Predictive Maintenance attempts to detect the onset of a degradation mechanism to correct it before the significant deterioration in the component or equipment. Corrective maintenance is a repair necessary to return the equipment to properly functioning condition or service and may be either planned or unexpected. Some equipment, at the end of its service life, may need an overhaul: a restoration to a completely service able condition as prescribed by maintenance serviceability standards.
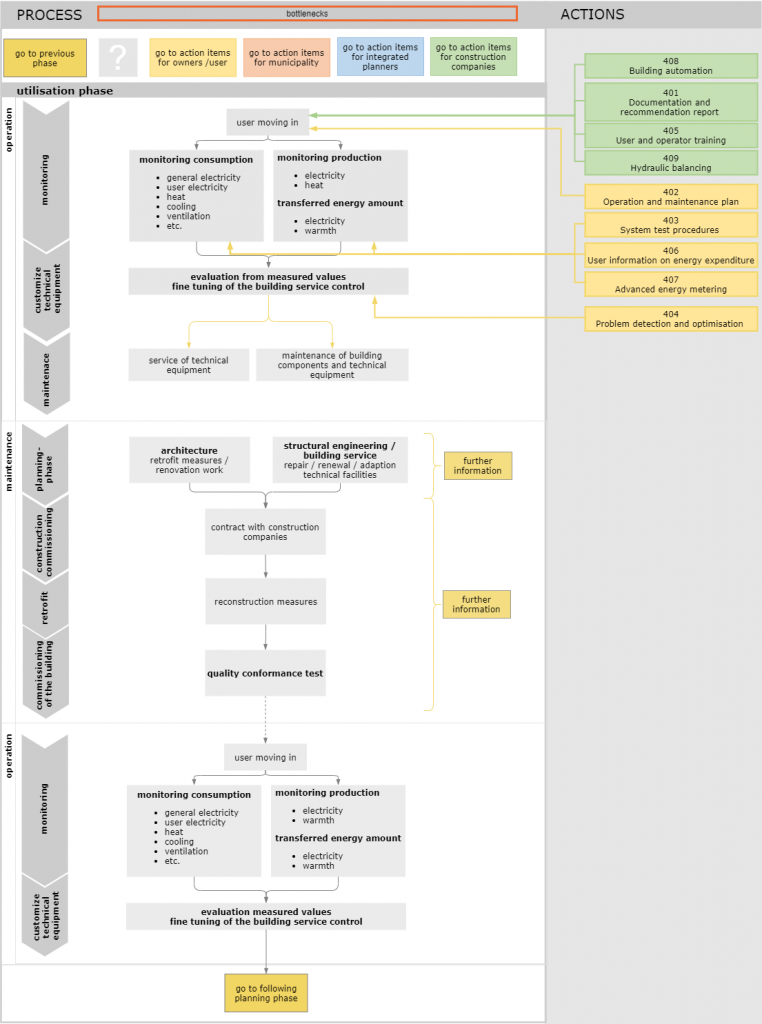
Figure: Building operation process with stakeholder related actions
End of life
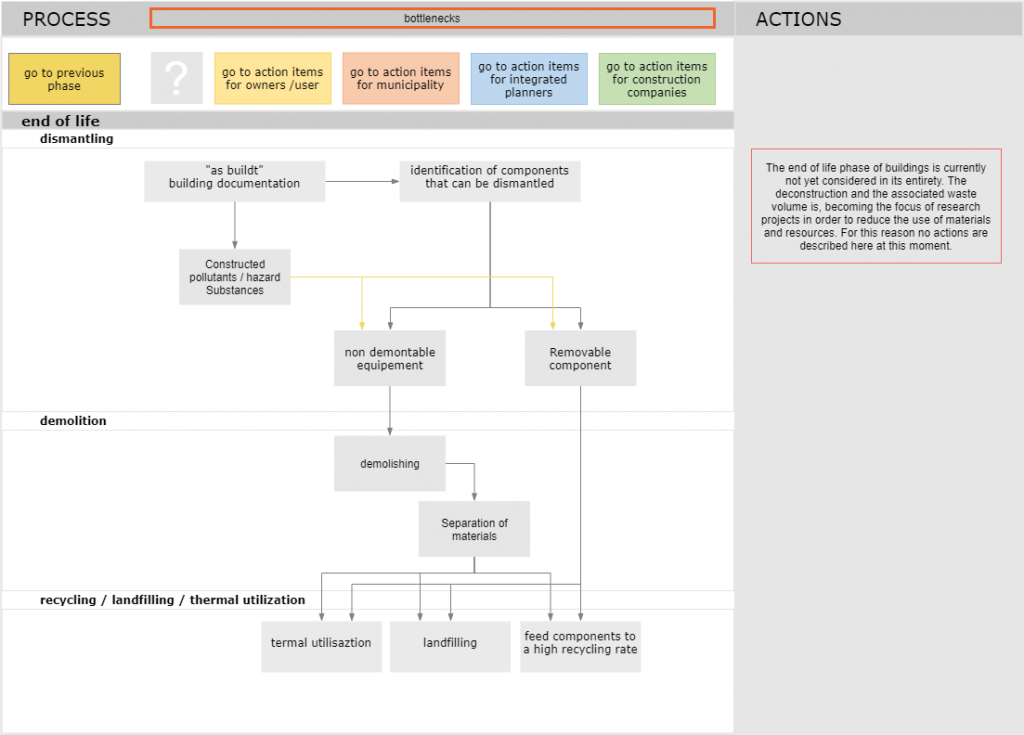
Figure: Building end of life process
Considering the building as a manufactured product also allows the application of lean management strategies, which have been widely used in the industry sector (starting from automotive). In the building sector, there are only a few experiences, mainly performed in big and very complex construction sites but also in smaller, standardized and highly industrialized concepts (for example BoKlok, a housing product by IKEA and Skanska). CRAVEzero focuses on lean construction and operational protocols, which can also be applied for low and mid-rise investment for low LCC nZEBs.
Lean construction is an approach developed to improve the efficiency and effectiveness of the construction process. Managing a lean construction means minimizing the waste of time, resources and materials, and thereby maximizing value. The presence of a general contractor, which manages and coordinates all suppliers and operators, makes it possible to optimize the entire system through collaboration, the elimination of obstacles and to fluidize the process, to achieve the value desired by the customer.
A key premise for successful lean construction is that materials and tools are available when an operation is scheduled to start, equipment, design and people are in place. Breaking down the work and planning it with a focus on letting the different disciplines work separately as much as possible in an area and handling the interfaces between disciplines. This can be achieved by defining several “construction phases” and sequencing these.
The constructions have to reach the maximum functionality, with the satisfaction of the final users. Manufacturers and suppliers have to be involved in the design as soon as possible, to achieve integration and cost-effectiveness of the building. Current achievements, progress, compliance with project requirements must be verified by specific coordinated and continuous measures. Better is facilitating quality control throughout the construction process, rather than doing this at the end when correcting problems is much more difficult and expensive.
Allowing an open communication between owner, project manager, contractors and engineering consultants is an issue that guarantees a better outcome.
The use of prefabricated systems and the displacement of the workings as much as possible outside the building site is a winning strategy. Using this technology it is possible to apply the principles of lean production to construction. Off-site construction reduces on-site work and locates it mainly in the factory, allowing reorganization of technologies and processes aimed at greater efficiency and quality. The main improvements between the standard method of construction and the off-site are:
Conclusion
The focus of the described “CRAVEzero process”, is to promote a common, interdisciplinary understanding of the complexity of nZEB planning processes for all involved stakeholders. A well organized and transparent process is a key feature for achieving the goal of cost-optimal and sustainable nZEBs throughout the entire life cycle phase.
In the previous chapters this process was described. The overall life cycle process of briefing, designing, constructing and operating nZEBs was illustrated in different life cycle phases. Actions, stakeholder-relations, pitfalls and bottlenecks were pointed out in detail. Key actions needed to ensure the achievement of energy and cost related goals for replicable planning, design, construction, and operation process were presented.
Based on the results from this guideline and to further provide an operative methodology to achieve the best conditions towards cost optimal nZEBs all achieved results of the report have been summarized and structured in a “lean management protocol” the so-called “life cycle tracker tool”.
As a main result this report comes along with the downloadable “life cycle tracker tool”, an easy-to-use Excel file with VBA macros that combines project roles, actions, and design responsibility matrix. It is based on the experience of the whole consortium in the area of holistic project management with a focus on integral building planning of nZEBs. It gives support on how key performance parameters to achieve successful nZEBs should be prioritized and can be tracked along the whole life cycle process.
It helps stakeholders in different phases of the life cycle to structure the whole planning, construction and operation process in a framework ensuring a high process quality of new nZEBs.

It can be downloaded here: http://pinboard.cravezero.eu
nZEB related co-benefits
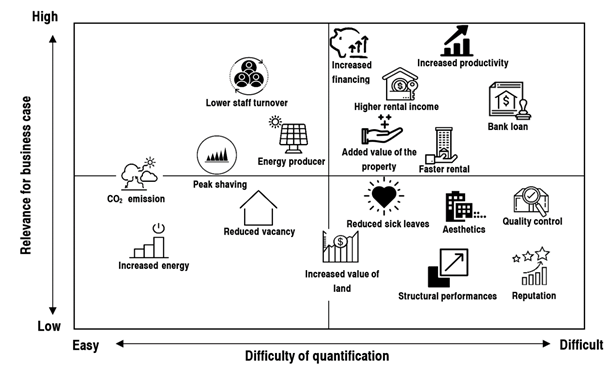
Figure 66: Co-benefits structured in terms of relevance for the business case and difficulty of quantification
The pinboard tool for the co-benefit analysis can be found here: https://www.cravezero.eu/pboard/Developer/RevenueInfo.htm
Specific additional incentives for nZEBs, so-called “co-benefits”, are often forgotten. Co-benefits are the added benefits that can be achieved, above and beyond the direct benefits of energy savings, climate protection and lower operational costs. They are also referred to as “multiple benefits” or “synergies”. These relate primarily to the occupants who are in the buildings every day. Especially for nZEB office buildings, it is important to understand that the following co-benefits can also have a financial impact. To show the relevance of these co-benefits, the following (Figure 66) shows how the individual co-benefits are structured in terms of relevance for business cases and difficulty of quantification.
- Health benefits
- Increased productivity
- Lower staff turnover
- Reduced sick leaves
- Employment creation
- Market potential
- Owner as energy producer
- Added value for a nZEB property
- Integration of RES
- CO2 emission savings
- Increased energy security
- Aesthetics and architectural integration
- Increased value of land/context
- Increased reputation and good publicity
- Press clipping increase
- Reduced vacancy due to nZEB
- Faster rental of the building
- Higher rental income
- Increased financing by lower interest rate
- Increased financing from bank loan
- Prefabricated building – quality control
- Prefabrication – cost and time efficiency and control
- Prefabricated building – on-site work
- Prefabricated building – façade integration
The advantages of these co-benefits can be very complex. This is due in particular to the fact that research is still in the early stages of these aspects. Therefore, it is often difficult to find statistically founded robust values that allow individual co-benefits to be quantified. However, some studies can serve as a basis for such quantifications. Recent papers that deal with employee turnover and employee satisfaction (Miller et al. 2009), productivity (Hedge, Miller, and Dorsey 2014), (Thatcher and Milner 2014) and employee absenteeism (Singh et al. 2010) already provide estimations for the implementation of co-benefit evaluation.
Studies show that employees in nearly zero energy buildings perceive a positive effect of their working environment and productivity (Thatcher, 2014), (Singh, 2010). In one case, a 10,000 m2 office building, an increase in productivity of 0.3 % was reported, equivalent to 8 €/m2a.
A study has noted a decline in absenteeism in nearly zero energy buildings (Thatcher, 2014).
An American study showed that around 20-25 % of 534 companies reported higher employee morale, easier recruitment of staff and more effective customer meetings (Miller, 2009). Also, 19 % reported lower employee turnover.
In addition to well-being and productivity, higher revenues from rent or sales may be expected. (Bleyl., 2017) reviewed previous studies and concluded that higher rent income might range roughly between 5 % and 20 %. Furthermore, higher market valuations may range from below 10 % to up to 30 %.
It should be noted, concerning green buildings, productivity and wellbeing, that a recent study pointed out, that social factors may have a more significant impact, in monetary terms, than environmental factors (Hugh, 2016).
The value of positive news articles about a specific building or a specific project could also be comparable to advertising costs in the specific source, in which the article is published (Berggren, 2017).
In order to obtain a targeted overview of the users’ understanding of co-benefits, a survey was launched as part of the EU Horizon 2020 project CoNZEBs (2017-2019). The focus was placed on indoor air quality, comfort, building location and low energy costs (Zavrl. 2019).
Depending on the perspective of the stakeholders, the interests, target criteria, and co-benefits can vary significantly. Figure 19 shows the criteria and co-benefits according to the interests of the different stakeholders. To achieve low heating costs, for example, the tenant is not only interested in low rental costs but also low operating costs and therefore a good energy standard. As a general rule, the building contractor aims to keep his construction costs low. For properties used by the owner, both cost components are essential, the initial investment and the operating costs. For public owners and users, the total life cycle costs and also the effects such as CO2 emissions are of interest.

Figure 67: Stakeholder related benefits and co-benefits of nZEBs
To assess the direct monetary value of a building, there are various co-benefits for the individual stakeholders, which often cannot be assessed directly in monetary terms and therefore do not appear in the life cycle cost analysis. These concerns marketability, rentability, value development, comfort, but also image, climate protection or regional goals such as energy autonomy. As far as possible, these advantages and additional benefits should be taken into account by the various stakeholders in the relevant decision-making process. These additional criteria can often overlap with the main criteria. An example is the use of an air-source heat pump in a very noise-sensitive environment. The air-source heat pump may perform relatively well in terms of energy and costs, including life cycle costs, but can cause problems due to increased noise pollution on the property and adjacent land. For this reason, it is crucial to quantify the added value of nZEBs in monetary terms by communicating and presenting business opportunities in such a way that potential investors understand and weigh up the pros and cons of an investment (Bleyl, 2016).
Methodology
In two CRAVEzero case studies, various co-benefits such as increased productivity, improved health, advertising value e.g. are examined to show the effects of individual co-benefits on payback time in particular.
Cost-benefit analysis of nZEBs for project developers
Using the calculation bases of (Berggren, Wall, & Togerö, 2017), effects of various co-benefits on the life cycle costs of nZEB were quantified. The following formula explains the procedure of these calculations.
The value of reduced energy consumption and exported energy described in the first formula summarizes the reduced energy costs (REC). For this purpose, the profitability of the increased costs associated with increased energy efficiency and the environmental values of the building were evaluated. In addition, investment costs were compared with energy efficiency and other sustainable values. Maintenance and renewal costs are not included in this formula.
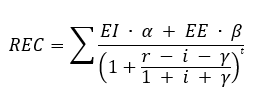
Where: EI is reduced imported energy, EE is increased exported energy, α is energy tariff of EI, β is energy tariff of EE, r is the nominal discount rate, i is the inflation rate and γ is increased in energy tariffs
Based on this calculation of (Berggren, Wall, & Togerö, 2017), a sensitivity analysis was carried out to show the effects that different co-benefits can have on the payback time of an nZEB.
Case Studies
The industry partners of the CRAVEzero consortium provided information on 12 existing reference buildings, considered as representative of the current best practices in the construction of new nZEBs with different functions and contexts. The industry partners participated in the design and/or the construction or operational phase of the buildings, and thus have access to detailed relevant data. These case studies include both residential, and office buildings and are located in the CRAVEzero countries: Austria, France, Germany, Italy and Sweden. Two of these case studies were used for the co-benefit analyses.
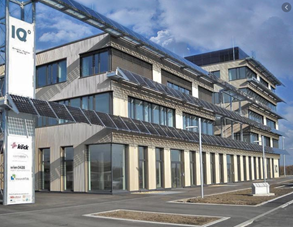
Figure 68: Aspern IQ
General information
- Owner: City of Vienna
- Architect: ATP Wien
- Energy concept: Renewable power, environmental heat, and waste heat
- Location: Vienna (Austria)
- Year of construction: 2012
- Net floor area: 8817 m2
Key technologies
- Groundwater heat pump
- Photovoltaics
Aspern IQ is located in Vienna’s newly developed urban lakeside area “Aspern” – Austria’s largest urban development project and also one of the largest in Europe. The building was designed in line with Plus Energy standards and is conceived as a flagship project which showcases the approach to creating a plus energy building which is adapted to locally available materials and offers the highest possible level of user comfort while meeting the demands of sustainability.
In the Aspern IQ reference building, to be able to filter out the influences of the individual co-benefits, the economic and energetic building data were used in order to be able to map the influences as accurately as possible. A parametric cost-benefit analysis with changing individual parameters of the co-benefits was performed to see how the added values affect the project. For this purpose, the data shown in Table 14 below were determined. The assumed property value was determined using a comparative value method with comparable buildings in Austria.
Table 16: Data of the reference building
| Financial | |||
| Residential/non residential | Non-residential | ||
| Saleable / rentable area | 6,600.00 | m² | |
| Expected sales year of property | 30 | years | |
| Assumed property value | 3,914.00 | €/m² | |
| Rents to tenants | 144.00 | €/m²a | |
| Expected yield | 10 | % | |
| Rental or owner-occupation | Rental | ||
| Estimated vacancy rates | 6 | % | |
| Number of employees | 250.00 | employees | |
| Energy | |||
| Treated floor area | 6,633.00 | m² | |
| Heating demand | 50.00 | kWh/m²a | |
| Cooling demand | 10.00 | kWh/m²a | |
| Electricity demand | 40.00 | kWh/m²a |
Furthermore, with regard to the fact that this is a nearly zero energy building, there are additional aspects concerning the economy which cannot be ignored under any circumstances. This concerns particularly the additional costs and the energy targets of the construction of a nearly zero energy building.
Table 17: Aspects which are based on high quality nearly zero energy buildings
| Financial | |||
| Additional nZEB costs | 171.60 | €/m² | |
| Energy | |||
| Heating demand | 21.00 | kWh/m²a | |
| Cooling demand | 2.00 | kWh/m²a | |
| Electricity demand | 18.00 | kWh/m²a | |
| PV yield | 14.55 | kWh/m²a | |
| PV yield: self-consumption | 10.00 | kWh/m²a |
Based on this building data, the different co-benefits were considered in Aspern IQ. Calculation results with and without the consideration of co-benefits clearly show the influence of the individual parameters on the overall cost curve over 30 years and especially the breakeven of the additional nZEB investments as can be seen in Figure 69. The following list shows the applied co-benefits.
• Yield reduction due to high quality nZEB
• Reduced vacancy
• Higher rent
• Faster rental of the building
• Reduced maintenance costs
• Number of press clippings
• Increased productivity
• Lower staff turnover
• Reduced sick leaves
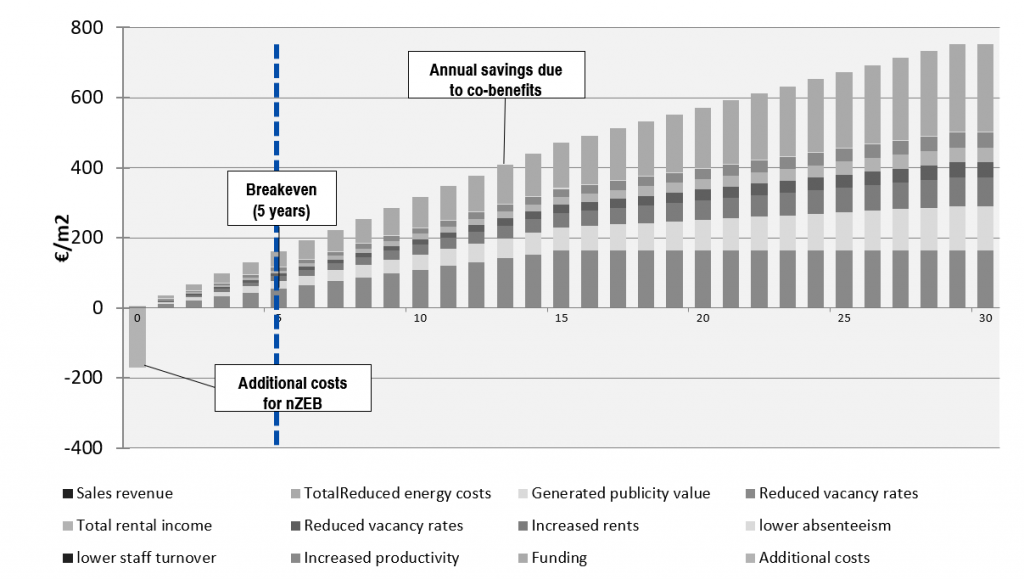
Figure 69: Payback time and breakeven point under consideration of co-benefits over a time period of 30 years
Results
SA has been performed first, applying the DSA method and then the EE method. For each one of these methods, the two approaches for the baseline values, previously illustrated, are displayed. Moreover, the discount rate has been inserted as a variable parameter to add the effect of its variation to the SA. In DSA the effects, the sensitivity index for 3 scenarios was calculated: discount rate 1, 2 and 3 %. In the EE method, the discount rate was added to the investigated parameters.
In the first approach, where real values for the baselines are adopted, the three most influencing co-benefits are “higher rent”, “yield reduction due to a high quality nZEB” and “reduced vacancy”. However, quite different outcomes are obtained if the second approach is considered: the most influencing values by far are “yield reduction due to hq nZEB” and “increased productivity”.
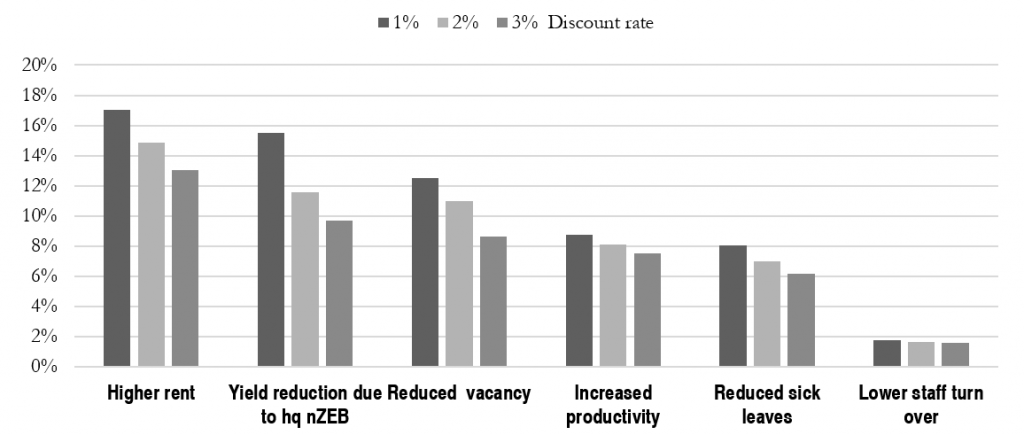
Figure 70: Sensitivity index related to real values baseline – discount rate 1, 2 and 3%
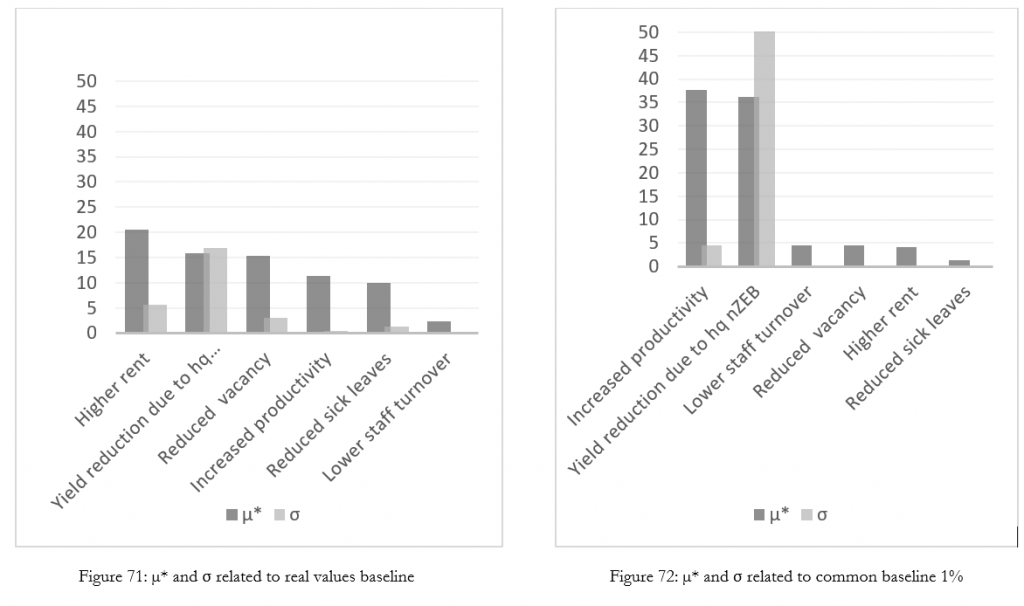
In (Berggren et al., 2018), increased productivity is indicated as the co-benefit with the largest relative impact. This statement is confirmed by results obtained with the second approach, which applies a fixed variation of 1 % equal to all co-benefits. A productivity increase of 1 % corresponds to 22 €/(m2a) of labor cost savings, assuming an average monthly salary per employee of 3,000 € and employer & social costs (excl. holiday allowance) equal to 60 %. Nevertheless, the questions that should be further investigated are “how much can actually the productivity increase vary?”, “Is it plausible a productivity increase of 1 %? And 2 %?”.
(Bleyl et al., 2017) state that in some cases a rent increase related to a green building can range from below 4 % up to 21 %. For this analysis a 5 % rent increase has been conservatively selected for the approach which takes into account baseline values from the literature. Nevertheless, in this case, this co-benefit showed the highest sensitivity index and µ*.
Väla Gård
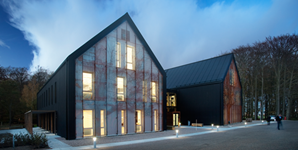
Figure 73: Väla Gård
A prefabricated 120 mm concrete wall with 200 mm graphite EPS is used. Heat and hot tap water are produced using a geothermal heat pump, the geothermal solution can also be used for cooling. Demand controlled ventilation system is used to ensure air quality with sustained energy performance.
Based on the equations presented in section 6.3 Methodology, the following parameters were investigated:
- Reduced energy costs (due to decreased energy demand)
- Increased rental income (due to lower vacancy rate)
- Publicity value (based on number of press clippings)
- Increased productivity
- Lower staff turnover
- Lower sick leaves
To investigate the effect of the co-benefits listed above, a reference building is defined, towards which the case study, Väla Gård, is compared to. The reference building and boundary conditions are described in Table 18. Input data for the investigated parameters are described in Table 19.
Initially, each parameter is investigated followed by a combination of all parameters. A sensitivity analysis is included. The sensitivity analysis involves a variation of each parameter by ±25 % when all parameters are combined.
Table 18: Summary of reference building and boundary conditions
| Financial info – reference building | |
| Type of building | Non-residential |
| Saleable/rentable area | 1 600 m2 |
| Rent to tenants | 70 €/m2a |
| Vacancy rate | 15 % |
| Employees | 70 persons |
| Energy – reference building | |
| Treated floor area | 1 670 m2 |
| Heating energy (electricity) | 22 kWh/m2a |
| Cooling energy (electricity) | 5 kWh/m2a |
| Electricity, excluding heating and cooling | 65 kWh/m2a |
| Boundary conditions | |
| Nominal discount rate | 7 % |
| Inflation | 2 % |
| Tariff for imported energy | 0.12 €/kWh |
| Tariff for exported energy | 0.10 €/kWh |
| Annual energy tariff increase | 2 % |
| Average salary costs | 6 350 €/employee |
| Average employee turnover, Sweden (Statistics Sweden, 2020) | 4 % |
| Average sick leave | 6 days/year |
| Value for publicity | 3 500 €/article |
Table 19: Input data for investigated parameters
| Reduced energy costs | |
| Heating energy | 4 |
| Cooling energy | 1 |
| Electricity, excluding heating and cooling | 35 |
| Increased rental income | |
| Vacancy rate | 5 % |
| Publicity value | |
| Press clippings | 10 articles |
| Increased productivity | |
| Increased productivity | 0.5 % |
| Lower staff turnover | |
| Reduced employee turnover | 0.5 % |
| Lower sick leaves | |
| Reduced sickness absence | 10 % |
Results
In Figure 74, all co-benefits investigated above have been included. A base case (BC) is presented together with a worst-case and an optimal case. The base case is a case where all co-benefits above have been included together with the additional costs and the cost reductions received in the project. In the worst case, the additional costs have been increased by 25 % and the business benefits have been reduced by 25 %. In the optimal case, the changes are the opposite. I.e. additional costs have been reduced by 25 % and the business benefits have been reduced by 25 %. In the base case, the cumulative savings exceed the additional costs after roughly four years. In the optimal and worst case, the cumulative savings exceed the additional cost after roughly three and eight years respectively.
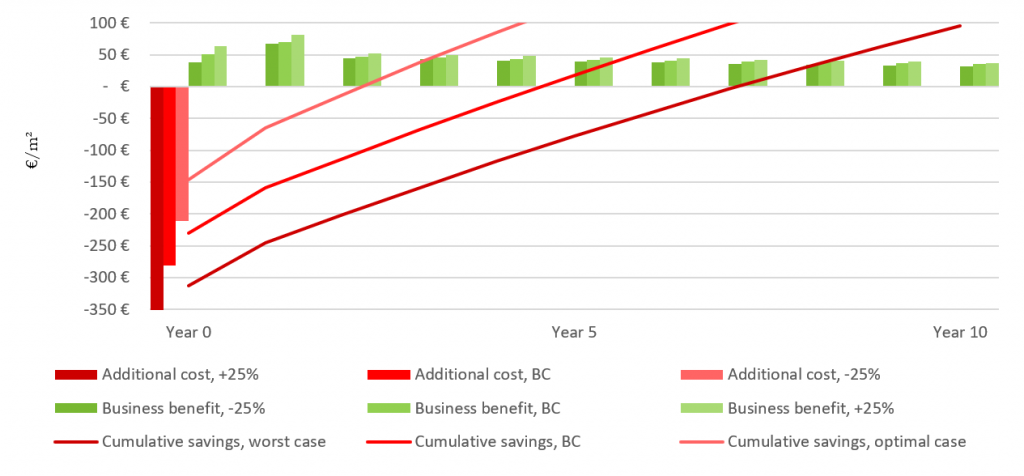
Figure 74: LCC-analysis for Väla Gård, including all benefits listed before
Conclusion
The co-benefits have been analyzed in particular with regard to their influence on the payback time and profit over a period of 30 years for the case studies Aspern IQ and Väla Gard. Increased productivity of the employees due to higher building quality and comfort and a possible higher rental income due to a better building standard are the most important factors with regard to the payback time and profit. But also the other co-benefits, which were examined here in more detail, have a significant influence.
Even influences which are usually not considered and harder to quantify, such as the productivity of the employees, reduced sick leaves or reduced vacancies, can significantly influence the economic success of a nZEB.
The case studies show that it may be hard to find it profitable to build a nearly zero energy building if one only account for improved energy performance or a single co-benefit. The profitability is significantly affected by further values than energy savings, which cannot balance the initial extra-investment for reaching the target nZEB if a short time perspective for evaluating profit is applied. However, the studies show that it may be very profitable to build nZEBs if one accounts for several green values.
Optimized nZEB – process map
The new CRAVEzero Report presents a manual of the “Interactive Life Cycle Process Map” (LCPM) developed within the CRAVEzero project. The process map connects all phases for the entire project lifecycle from the urban planning to design, operation and end of life phase. As a main result, this report also comes along with a downloadable “life cycle tracker tool”, an easy-to-use Excel file with VBA macros that combines project roles, actions, and design responsibility matrix. It is based on the experience of the whole consortium in the area of holistic project management with a focus on integral building planning of nZEBs. It gives support on how key performance parameters to achieve successful nZEBs should be prioritized and can be tracked along the whole life cycle process. It can be downloaded here:
Download the full report here
Pinboard: pinboard.cravezero.eu
Process Tracker Tool: http://www.cravezero.eu/pinboard/Downloads/CRAVEzero_ProcessTracker.zip
Process Map: http://www.cravezero.eu/pinboard/PMap/ProcessMap.htm
Process Map: http://www.cravezero.eu/pinboard/PMap/ProcessMap.htm

Actions, stakeholder-relations, pitfalls and bottlenecks, as well as the required goals, are pointed out in detail. Considering the importance and the complexity to reach nZEB-standard in a cost-optimal way for all the different stakeholders, multiple actions are required. These are, however missing in the standard planning process. This report provides a practical methodology to achieve the best conditions towards cost-optimal nZEBs in the whole planning, construction and operation process considering all relevant decisions, co-benefits, involved players as well as related cost reduction potentials. A process map that connects the entire project lifecycle for design, planning, operation and end of life phase accompanies this report. This process map is a workflow that points out cost reduction potentials through all the stages of the process where all the different parts are linked to providing summaries and reports to the decision-makers in leadership roles.
Process Map: http://www.cravezero.eu/pinboard/PMap/ProcessMap.htm
The
main additional advantages of integrating the “CRAVEzero process” into
standardized building processes are listed as follows:
- Reduce risks
- Speed-up construction and delivery
- Control costs and energy performance
- Foster integrative design and make optimal use of team members’
expertise - Establish measurable success criteria
MapausCRAVEzero_D32_OptimizednZEBProcessMap
Process Map: http://www.cravezero.eu/pinboard/PMap/ProcessMap.htm
Stakeholder related processes
Figure1 Stakeholders’ time expectancy of a nZEB project
In order to be able to optimise existing processes, technical qualifications, actions to be taken and roles must be known and tasks and functions of the stakeholders assigned. The assessment of the process for nZEBs depends strongly on the perspective. Building owners, investors, tenants, the construction industry, providers of energy efficiency solutions and planners have different interests and are involved in different phases in the life cycle of buildings. There is a general lack of understanding, transparency and uniform methods when it comes to the overall process of nZEBs. Which costs and time horizons are significant for different actors and to what extent?
Figure2: Stakeholders’ influence in nZEB life cycle phases
nZEB Processes

Download the full report here:
In addition to legal and urban boundaries, buildings are essentially defined by the client. Owners or investors want to construct or renovate buildings for a specific purpose. Also, the buildings technical quality and the comfort standard have to be achieved within project specific budget limitations. Architects and specialised planners translate the client’s ideas and wish into real plans and are responsible for the appropriate execution of the building project. Construction companies and craftsmen from numerous different disciplines are involved in constructing the building.